Key Takeaways
- RUA (Reporting URI for Aggregate) reports provide a comprehensive 24-hour summary of all email traffic using your domain, revealing who is sending on your behalf.
- Unlike forensic reports, RUA reports do not contain email body content or personally identifiable information (PII), making them safe for global data privacy compliance.
- These reports are the primary tool used to identify spoofing attempts and misconfigured legitimate services.
- Raw XML reports are difficult to read manually; using an automated analyzer is the industry standard for 2026.
- Consistent analysis of RUA data is the only safe way to move your policy to p=reject without blocking “good” mail.
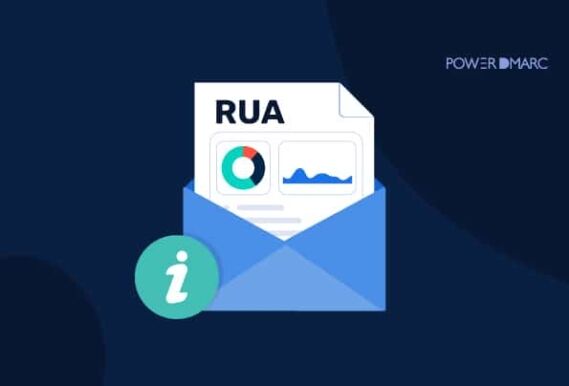
Every 24 hours, receiving mail servers send you a structured data set – a DMARC aggregate report (RUA) – documenting every IP address that sent email using your domain: what passed, what failed, and what was rejected. When your morning starts with delivery failures and spam complaints, this is where you find the source.
These reports, however, arrive as dense XML files that aren’t exactly human-friendly. So while the data is powerful, unlocking it requires the right lens.
In this guide, we’ll break down what DMARC aggregate reports actually contain, how to read them without losing your sanity, and how to turn that raw data into something far more useful.
What Is a DMARC Aggregate Report?
A DMARC aggregate report is a daily XML summary sent by receiving mail servers to domain owners, covering all email traffic that claims to use your domain over a 24-hour period.
Unlike forensic reports, RUA reports are privacy-safe. They do not contain individual email content, subject lines, or personally identifiable information (PII); instead, they focus on IP addresses, volumes, and authentication results.
Raw XML (Simplified)
<feedback>
  <report_metadata>
    <org_name>google.com</org_name>
    <date_range>24h</date_range>
  </report_metadata>

  <policy_published>
    <domain>example.com</domain>
    <p>reject</p>
  </policy_published>

  <record>
    <source_ip>209.85.1.1</source_ip>
    <count>1284</count>
    <dkim>pass</dkim>
    <spf>pass</spf>
  </record>
</feedback>
Parsed By
Reporting Organization
Who sent the report (Google, Microsoft, Yahoo)
Report ID • date range • contact email
Your active policy during the reporting period
Domain • alignment mode • p=none/quarantine/reject
Sending IP Address
Every server that sent email using your domain
Catch unauthorized senders & spoofing IPs
Authentication Results
SPF, DKIM, and DMARC results per source
pass
fail
per SPF • per DKIM
DMARC Aggregate vs. Forensic (RUA vs. RUF)
RUA (aggregate) reports provide a daily, high-level summary of all email activity using your domain, while RUF (forensic) reports are real-time, per-incident alerts that detail individual authentication failures. In short, RUA shows the big picture, and RUF zooms in on specific problems, though it’s less widely supported due to privacy concerns.
Here are the main differences between RUA vs RUF reports.
Frequency
Once every 24 hours
What it covers
All email traffic — pass and fail
Privacy

No PII — safe for all regions
Best For
Day-to-day monitoring & enforcement
vs
Frequency
Real-time, per failure
What it covers
Individual failed emails only
Privacy
May contain subject lines
Best For
Investigating specific spoofing attacks
What Data Does a DMARC Aggregate Report Contain?
While a raw XML file may look intimidating, it organizes data into specific record blocks that reveal your authentication health.
This section details who prepared the report and the covered period:
- Report ID: A unique identifier for the specific report.
- Date Range: The specific 24-hour window during which activities were monitored.
- Organization Name: The entity that generated the report, typically a mailbox provider.
- Contact Information: Details on how to contact the reporting organization.
2. Published DMARC Policy
This details the specific policy (p=none, quarantine, or reject) that was active in your DNS during the reporting period.
3. Record Blocks
Each record block provides details on a specific set of emails based on their source:
- Source IP: The originating IP address of the evaluated emails.
- Count of Messages: The total volume of emails sent from that IP during the period.
- Policy Evaluated: The action taken (disposition) and whether it aligned with your policy.
- SPF and DKIM Results: The specific pass/fail results for each authentication method.
How Do I Enable DMARC Aggregate Reports?
To receive these reports, you must add the rua= tag to your DMARC DNS TXT record.
Example Record:
v=DMARC1; p=none; rua=mailto:[email protected]
If you need to send reports to an external domain, the recipient domain must publish a specialized DNS record granting permission.
How to Read a DMARC Aggregate Report
Reading DMARC aggregate reports manually involves parsing XML tags like <record>, <row>, and <auth_results>.
Identifying Trends
Individual reports tell a short story, but they are best used in combination to monitor ongoing progress. For example, a high number of failures from a specific IP over time may indicate a spoofing attempt or a misconfigured legitimate server.
XML Example Snippet
<source_ip>192.168.1.1</source_ip> <count>1023</count> <disposition>none</disposition> <dkim>pass</dkim> <spf>fail</spf>
In this snippet, emails from IP 192.168.1.1 passed DKIM but failed SPF. Since the disposition is none, no action was taken despite the failure.
Why Do DMARC Aggregate Reports Matter for Email Security?
You cannot protect what you cannot see. RUA reports are rich with actionable insights to help your business:
- Boost Deliverability: Identify issues where legitimate emails are being flagged as spam and adjust configurations to fix them.
- Improve Security and Compliance: Identify unauthorized senders attempting to impersonate your brand or maliciously use your domain.
- Reach Enforcement Safely: Provide the visibility needed to move from p=none (monitor only) to p=quarantine or p=reject without blocking legitimate mail.
- Control Shadow IT (unauthorized cloud services used by employees without IT approval): Discover third-party cloud services that may be sending email on your behalf without your knowledge.
How to Use DMARC Aggregate Reports Effectively?
To maximize the value of your DMARC aggregate reports, you need to transition from passive data collection to active domain management. Since raw XML is notoriously difficult to parse manually, following these six strategic best practices will help you reach a state of full DMARC enforcement (p=reject) with confidence.
1. Leverage a Specialized DMARC Analysis Solution
While you can technically open XML files in a text editor, doing so for hundreds of reports is impractical at scale. A specialized tool like the DMARC report analyzer does the heavy lifting by:
- Translating XML to Visuals: Converting thousands of lines of code into intuitive geo-maps, pie charts, and threat intelligence dashboards.
- Automated Source Identification: Instead of just seeing an IP address like 209.85.220.41, a professional analyzer identifies the service by name (e.g., “Google Workspace” or “Salesforce”).
- Error Highlighting: Automatically flagging syntax errors in your SPF/DKIM records that might be causing legitimate mail to fail.
2. Establish a Consistent Review Cadence
Email ecosystems are dynamic; new marketing tools are added, and IP ranges for third-party vendors change frequently.
- Daily Monitoring: During the initial setup phase (at p=none), check reports daily to ensure no legitimate traffic is failing.
- Weekly Audits: Once your policy is at p=quarantine or p=reject, a weekly review is usually sufficient to monitor for new spoofing attempts or “Shadow IT” (unauthorized cloud services being used by different departments).
- Proactive vs. Reactive: Don’t wait for a deliverability crisis or a phishing attack to occur before you look at your RUA data.
3. Drill Down into High-Volume Failure Details
Not every failure is a security threat, but high-volume failures are almost always significant.
- Identify the “Who”: Look for IP addresses that are sending thousands of emails but failing DMARC.
- Configuration vs. Malice: If the IP belongs to a known vendor (like HubSpot or Mailchimp), the failure indicates a configuration error in your SPF or DKIM setup. If the IP is unrecognized and originating from a high-risk region, it is likely a spoofing attempt.
- Check Result Codes: Pay attention to why it failed; was it an alignment issue (the domain in the ‘From’ header didn’t match the authenticated domain) or a total authentication failure?
4. Analyze Long-Term Trends and Seasonality
DMARC aggregate reports provide a “snapshot” of 24 hours, but the real intelligence lies in the trends.
- Baseline Traffic: Understand your “normal” volume so you can immediately spot anomalies, such as a sudden spike in traffic that could indicate a botnet attack.
- Policy Impact: Track how your authentication pass rate improves as you refine your records. A steady upward trend in “DMARC Pass” percentages is the green light you need to move to a stricter policy.
- Historical Comparison: Maintain at least 6–12 months of historical data to comply with security audits and to identify seasonal fluctuations in email volume.
5. Create an Actionable Feedback Loop
Data is only useful if it leads to optimization. Use the insights from your reports to:
- Refine SPF Records: Remove old, unused IP addresses or vendors to stay under the 10-DNS-lookup limit.
- Update DKIM Keys: If reports show DKIM failures for a specific office location, it may be time to rotate your keys or fix a broken selector.
- Address Alignment Issues: Many vendors pass SPF/DKIM but fail DMARC because the “Return-Path” doesn’t match your brand domain. Reports tell you exactly where you need to implement “Custom Return-Path” or “Custom DKIM” settings.
DMARC report history serves as audit evidence for compliance frameworks, including SOC 2, HIPAA, and PCI-DSS.
- Log Actionable Events: Document when you added a new vendor, when you changed your policy from none to quarantine, and the reasoning behind it.
- Regulatory Evidence: If an auditor asks how you protect customer data from email spoofing, your DMARC reports and your log of remediation actions serve as definitive proof of your security posture.
- Knowledge Transfer: Documentation ensures that if your primary email administrator leaves the company, the new team member understands the existing email architecture and authorized senders.
How Does PowerDMARC Simplify DMARC Reporting?
Processing hundreds of XML files manually is impractical at scale. PowerDMARC automates the entire lifecycle of your reports, moving beyond basic parsing to provide a complete Security Operations (SecOps) experience.
Advanced Automation and Visualization
- Automatic XML Parsing: PowerDMARC converts complex XML data into human-readable dashboards, geo-maps, and charts, no manual reading required.
- Sender Identification: Our solution identifies your services by name (e.g., Salesforce, Zoom) rather than just ambiguous IP addresses, which allows for Quick Identification of legitimate vendors vs. bad actors.
- Non-Standard Data Handling: PowerDMARC is built to handle RFC-violating reports from providers like Microsoft, which ensures your data is never incomplete.
- Hosted SPF & DKIM: Tired of the 10-DNS-lookup limit? Our hosted tools allow you to manage records directly from the dashboard without touching your DNS, which solves the “Too many lookups” error instantly.
- BIMI (Brand Indicator for Message Identification) with VMC (Verified Mark Certificates) Support: Go beyond security by displaying your verified brand logo in recipient inboxes, which helps boost open rates and trust.
- DMARC for Managed Service Providers (MSPs) & Multi-tenancy: Updated with enhanced Global Visibility, our platform allows managed service providers to oversee hundreds of domains from a single pane of glass.
- AI-Powered Threat Intelligence: Use our updates to identify spoofing patterns and receive automated alerts when a new unauthorized sender is detected using your domain.
- Personalized PDF Reporting: Generate executive-ready reports with one click, which helps document your journey from p=none to p=reject for compliance audits.
Summing Up
In the evolving threat landscape of 2026, relying on “blind” email sending is no longer an option. DMARC aggregate reports are the most powerful tool in an administrator’s arsenal for gaining visibility and control over domain usage. By transforming raw XML data into actionable intelligence with PowerDMARC, organizations can proactively stop phishing, improve email deliverability, and ensure compliance with global bulk-sender mandates.
Frequently Asked Questions
What is a DMARC aggregate report?
A daily XML summary of email authentication activity, SPF, DKIM, and DMARC results, sent by receiving mail servers to domain owners.
How often are these reports sent?
Typically once every 24 hours per reporting organization (e.g., Google and Microsoft send separate reports).
Do these reports contain personal data?
No. They include IP addresses and volumes but no email body content or PII, making them safe for all regions.
Can I send reports to an external domain?
Yes, but the external domain must publish a DNS record granting permission to receive those reports.
How do I enable DMARC aggregate reports?
To enable DMARC aggregate reports, add a TXT record to your DNS settings:
Move to p=quarantine or p=reject when you’re ready. This provides the visibility needed to secure your domain, where 91% of cyberattacks originate.

Milena is a skilled writer and content creator with 7+ years of experience in crafting engaging content on IT, cybersecurity, virtual events, and more. She has a proven track record of delivering high-quality work for international magazines and is a graduate of prestigious institutions such as New York University Abu Dhabi, UWC China, and the College of Europe.
Latest posts by Milena Baghdasaryan
(see all)